Jobs
In June 2010, the level cap was raised for the first time in six and a half years. This year’s census looks at how job demographics have changed over the past two years. Let’s take a closer look at the main job level distribution and the popular job rankings.
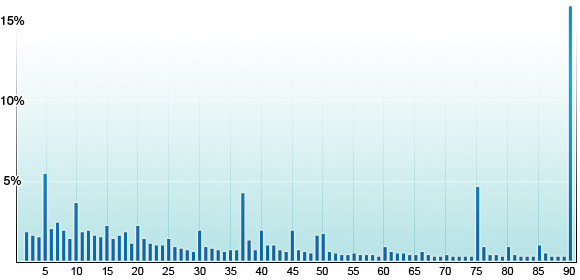
The graph below details the level distribution of main jobs from level 2 to level 90.
The first thing you will notice when looking at the graph is that level 90 characters make up 15.56% of all players. This is about the same percentage of players who were at level 75 at the time of the last census. The second highest number of players is at level 5. This can most likely be attributed to players hoping to make their dreams come true through the Mog Bonanza, with the new ability to deliver exclusive items to other characters on the same account.
One can see that the percentage of characters at level 37 has decreased, with levels 40, 45, and 50 showing increases. This can be attributed to the level cap increase allowing for higher support job levels, as well as experience points becoming more readily obtainable.
| Job Levels | Population Distribution |
| 1 | 67.34% |
|
|
Next, let’s take a look at the distribution of main jobs.
Up until now, mages had been at the top of the rankings, but this year, they were surpassed by the damage-dealing monk and warrior, which took first and second place. We can also see from the data that the beastmaster, summoner, and dancer jobs have significantly risen in position.
As usual, the top six ranks are all standard jobs, but the overall ratio of standard jobs to extra jobs are about the same, with much less of a discrepancy between the most and least popular jobs than we have seen in the past.
| Ranking | Job | Percentage | Change from 2009 Census ( ) denotes 2009 ranking |
| 1 | Monk | 10.03% | ↑(6) |
| 2 | Warrior | 9.18% | ↑(5) |
| 3 | White Mage | 7.78% | ↓(1) |
| 4 | Black Mage | 7.60% | ↓(3) |
| 5 | Thief | 7.29% | ↓(4) |
| 6 | Red Mage | 7.19% | ↓(2) |
| 7 | Ninja | 5.43% | ↑(8) |
| 8 | Dancer | 4.34% | ↑(13) |
| 9 | Beastmaster | 4.09% | ↑(15) |
| 10 | Summoner | 4.03% | ↑(16) |
| 11 | Samurai | 4.01% | ↓(9) |
| 12 | Dark Knight | 3.87% | ↓(11) |
| 13 | Paladin | 3.83% | ↓(7) |
| 14 | Ranger | 3.74% | ↑(17) |
| 15 | Bard | 3.59% | ↓(10) |
| 16 | Dragoon | 3.44% | ↓(12) |
| 17 | Blue Mage | 3.23% | ↓(14) |
| 18 | Scholar | 2.69% | → |
| 19 | Corsair | 2.54% | ↑(20) |
| 20 | Puppetmaster | 2.10% | ↓(19) |
Moving on, let’s take a look at the main and support job combinations. As in the last few censuses, the White Mage/Black Mage pairing was the most popular of all the countless combinations of jobs available in the game.
It should go without saying that a great deal of useful magic has been added, but among the spells added, the addition of Cure VI, and making Warp II a spell available to support jobs would seem to be likely reasons for this combination’s rise in popularity.
| Ranking | Job | Support Job | Relative Percentage |
| 1 | White Mage | Black Mage | 9.61% |
| 2 | Black Mage | White Mage | 6.60% |
| 3 | Red Mage | White Mage | 3.51% |
| 4 | Red Mage | Black Mage | 3.25% |
| 5 | Thief | Ninja | 2.88% |
| 6 | Monk | Warrior | 2.37% |
| 7 | Ninja | Warrior | 2.29% |
| 8 | Black Mage | Red Mage | 1.82% |
| 9 | Warrior | Monk | 1.79% |
| 10 | Ninja | Dancer | 1.74% |
| 11 | Dancer | Ninja | 1.53% |
| 12 | White Mage | Red Mage | 1.43% |
| 13 | Bard | White Mage | 1.30% |
| 14 | Warrior | Ninja | 1.27% |
| 15 | Blue Mage | Ninja | 1.25% |
| Others | 57.36% | ||
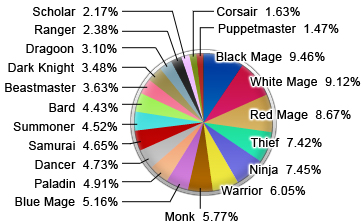
The graph below details the percentage of jobs at level 90. The most numerous jobs are the ever-popular spell-wielding black mage, white mage, and red mage, the evasive thief and ninja, and the physically formidable warrior and monk. It seems that many players are leveling jobs that complement each other in main and support job capacity.
* If a single character has leveled multiple jobs to level 90, all of those jobs have been counted in the data.
 |
 |
 |